QuickBooks Online is cloud-based and collaborative, but it does not support multi-entity consolidated budgeting natively. Budgets exist at a single-company level only. To consolidate, finance teams typically:
Export data to Excel or Google Sheets.
Maintain spreadsheet models for mapping and eliminations.
Adopt third-party applications such as FinBoard.ai for end-to-end automation.
For groups with multiple entities and geographies, this gap is material. Relying on QBO alone often translates into significant monthly effort for manual consolidation and reconciliation.
Executive Summary
Tracking budget versus actuals across multiple entities is inherently complex. Subsidiaries may:
Use different charts of accounts (COA).
Report in different currencies.
Operate on different fiscal calendars.
Yet boards, lenders, and investors expect a single, reliable group view.
Without a defined consolidation process, finance leaders risk:
Double-counting revenue and expenses from intercompany activity.
Missing eliminations of internal balances and profit.
Presenting misleading results that reduce credibility with stakeholders.
This guide outlines how to design a structured consolidated budget-vs-actuals process on a QuickBooks foundation. It covers:
Why consolidation matters.
Common challenges and practical solutions.
A step-by-step workflow.
Tool and workflow comparisons.
A QuickBooks-focused mini-case.
Best practices, pitfalls, and what is next.
Why Consolidated Budget vs. Actuals Matters
1) Investor and Stakeholder Credibility
Accuracy and discipline drive trust. A startup that overlooks eliminations and inflates results appears immature. Clean, defensible consolidated reporting supports valuation and confidence.
2) Operational Accountability
Consolidation reveals performance by subsidiary and at group level. For example:
Subsidiary A (US) underperforms budget by 10%.
Subsidiary B (India) outperforms budget by 5%.
The group variance is the net effect, but consolidation pinpoints where to add support, reduce costs, or invest.
3) Compliance and Audit Readiness
Auditors frequently test consolidated budget-to-actuals as part of variance procedures. Weaknesses here contribute to:
Delayed audits.
Higher audit fees.
Potential control deficiencies under SOX (US) or ICFR (Canada).
4) Strategic Resource Allocation
Budgets are planning instruments. Group-level visibility enables proactive reallocation when, for example, R&D overspends or marketing underspends across entities.
Key Challenges in Multi-Entity Budget vs. Actuals
1) Divergent Charts of Accounts (COA)
The most common bottleneck. Each entity may label similar items differently (e.g., “Subscriptions,” “SaaS Licenses,” “Cloud Services”).
Remedy: Establish a master COA and maintain entity-to-master mappings to ensure consistent, comparable reporting.
2) Intercompany Eliminations
The “phantom revenue” problem:
Entity A budgets $500,000 of software revenue billed to Entity B.
Entity B budgets the same amount as expense.
Without elimination, consolidated statements overstate both revenue and expense by $500,000.
Eliminations are required on the P&L and the balance sheet:
Intercompany A/R and A/P must offset.
Intercompany loans and advances must reconcile.
Intercompany profit in inventory (when selling internally at a markup) must be eliminated to comply with IFRS 10 and ASC 810.
3) Currency Translation
Global groups face persistent FX issues:
Entity A reports in INR, Entity B in EUR, parent consolidates in USD.
Policies to set:Budget rate policy (for example, use 1 USD = 80 INR for all budgets).
Actual rate policy (monthly or average actual rates).
Translation differences between P&L and balance sheet flow to Cumulative Translation Adjustment (CTA) under ASC 830 (US GAAP) or IAS 21 (IFRS). Missing this step prevents the consolidated balance sheet from tying.
4) System Limitations
QBO supports single-entity budgets only. Most teams therefore:
Export actuals and budgets to spreadsheets.
Build pivots and lookup models or use add-ons.
Spend hours managing formulas, links, and versions.
This can work for two or three entities, but becomes fragile and time-consuming at five to ten subsidiaries without automation.

Tool / Workflow Comparison
Approach | Pros | Cons | Best Fit |
|---|---|---|---|
Excel manual consolidation | Flexible, cheap, customizable | Error-prone, time-consuming | Small groups <3 entities |
QuickBooks Desktop Enterprise | Built-in budgets, divisional reports | Not cloud-native, license costs | Mid-size groups needing offline control |
QuickBooks Online + Spreadsheet Sync (Excel/Sheets) | Cloud-based, easy to share | Still manual eliminations | 3–5 entities, SaaS startups |
QuickBooks Online + Add-on | Automated consolidation, dashboards | Subscription fees, setup required | Scaling groups, 5+ entities |
Expanded Case Studies on Consolidated Budget vs Actual Reporting
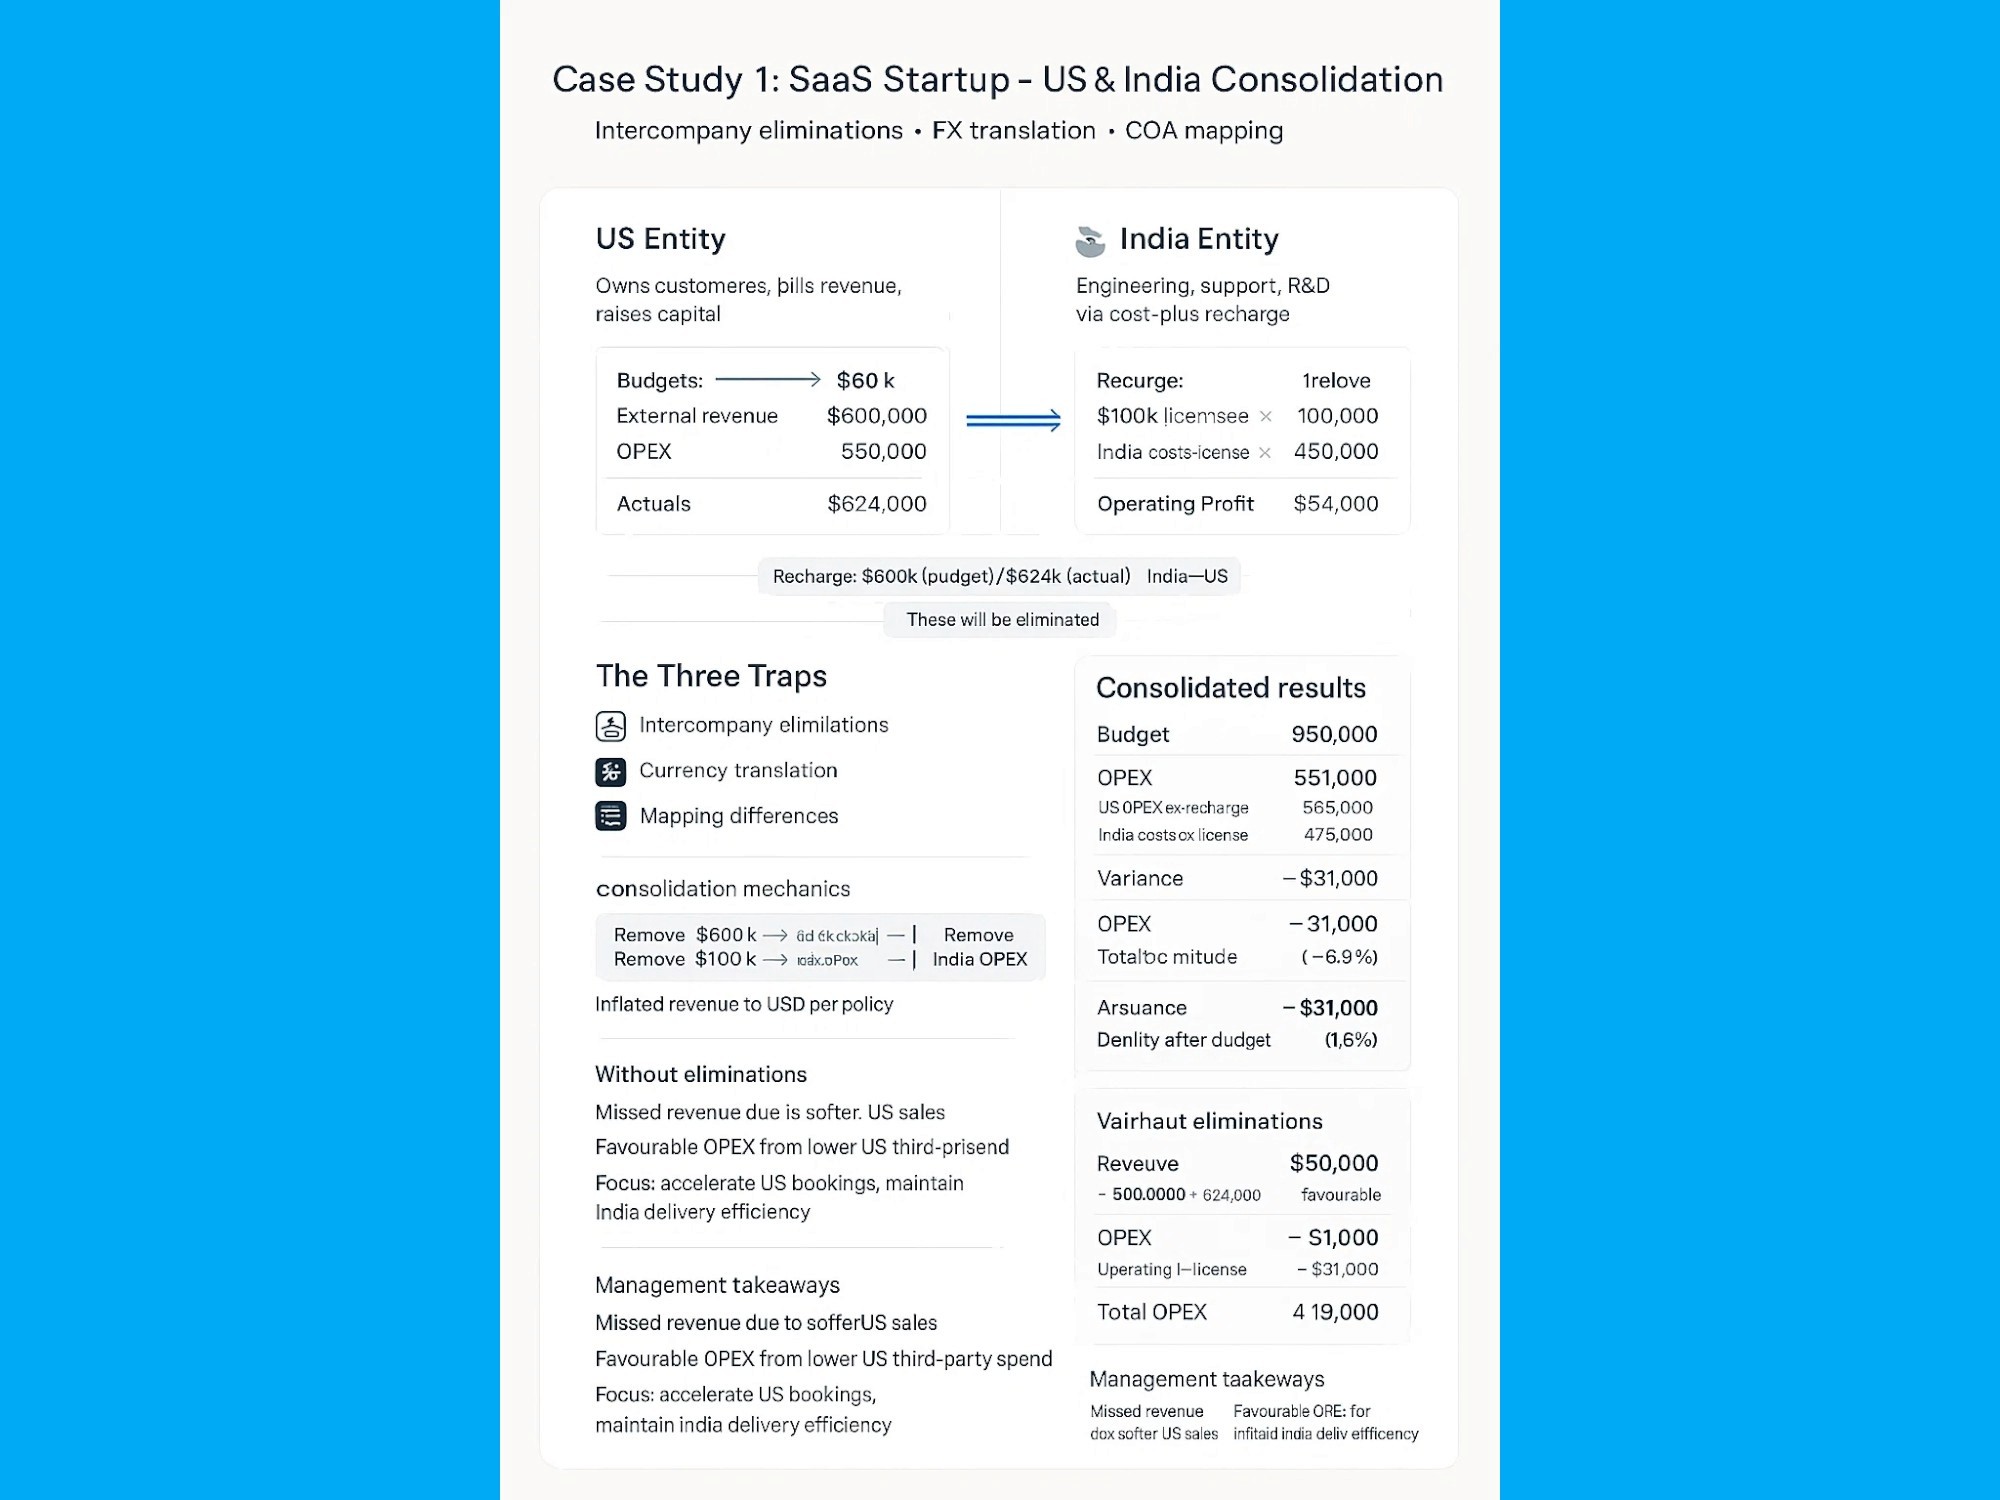
Case Study 1: SaaS Startup with US and India Entities
Scenario
A fast-growing SaaS startup operates two legal entities:
US Entity – owns customers, bills revenue, raises capital
India Entity – delivers engineering, support, and R&D via a cost-plus recharge to the US
Budgets (entity view)
US: External revenue $1,000,000; OPEX $700,000 (includes India recharge of $600,000)
India: Recharge revenue $600,000 (billed to US); Costs $550,000 (includes $100,000 SaaS license from US)
Intercompany: US → India $100,000 SaaS license fee
Actuals (entity view)
US: External revenue $950,000; OPEX $680,000 (includes India recharge of $624,000)
India: Recharge revenue $624,000; Costs $575,000 (includes $100,000 SaaS license from US)
Currency note: India books in INR. Group presents in USD. Translate India to USD using budget (plan) rate for budgets and average rate for actuals. (Example: Budget 82.0; Actual 83.5 INR/USD.)
The Three Traps
Inter-company eliminations
Eliminate India recharge revenue against US OPEX
Eliminate US license revenue against India OPEX
Currency translation
Keep plan vs actual rates consistent with your policy (e.g., budget at plan rate; actuals at period average)
Mapping differences
Map India “Professional Fees” into group “Operating Expenses” to keep comparability
Consolidation Mechanics (what gets removed)
Remove $600,000 (budget) / $624,000 (actual) India recharge from revenue
↔ Remove the matching amounts embedded in US OPEXRemove $100,000 (budget and actual) US license revenue
↔ Remove the matching $100,000 in India OPEX
Result: Group revenue shows only external customer revenue. Group OPEX shows only third-party costs (plus any non-eliminated items).
Consolidated Results (after eliminations and mapping)
Budget (USD, translated at plan rate)
Revenue: $1,000,000
OPEX: US OPEX excluding recharge (700,000 − 600,000 = $100,000)
India costs excluding US license (550,000 − 100,000 = $450,000)
→ Total OPEX: $550,000
Operating Profit: $450,000
Actual (USD, translated at average rate)
Revenue: $950,000
OPEX: US OPEX excluding recharge (680,000 − 624,000 = $56,000)
India costs excluding US license (575,000 − 100,000 = $475,000)
→ Total OPEX: $531,000
Operating Profit: $419,000
Variance (Actual vs Budget)
Revenue: −$50,000 (−5.0%)
OPEX: −$19,000 (favourable)
Operating Profit: −$31,000 (−6.9%)
What you would have gotten wrong without eliminations
Inflated Revenue: $950,000 (US) + $624,000 (India recharge) = $1,574,000
Misleading conclusion: “We beat plan on revenue.”
Reality after eliminations: Revenue is $950,000, which is below the $1,000,000 budget.
Management Takeaways
The group missed revenue by 5% due to softer US sales, not because India under-performed.
OPEX ran favourable versus budget, driven by lower US third-party spend.
The correct story is to accelerate US bookings while maintaining India delivery efficiency.
Implementation Checklist
Define intercompany matrices (who bills whom, for what, and where it lands)
Lock COA mapping (e.g., India “Professional Fees” → Group “Operating Expenses”)
Set FX policy (budget at plan rate; actuals at average rate; CTA to equity)
Automate eliminations (recharges, licenses, mark-ups) before reporting
Reconcile entity→group with drill-downs so reviewers can verify every line
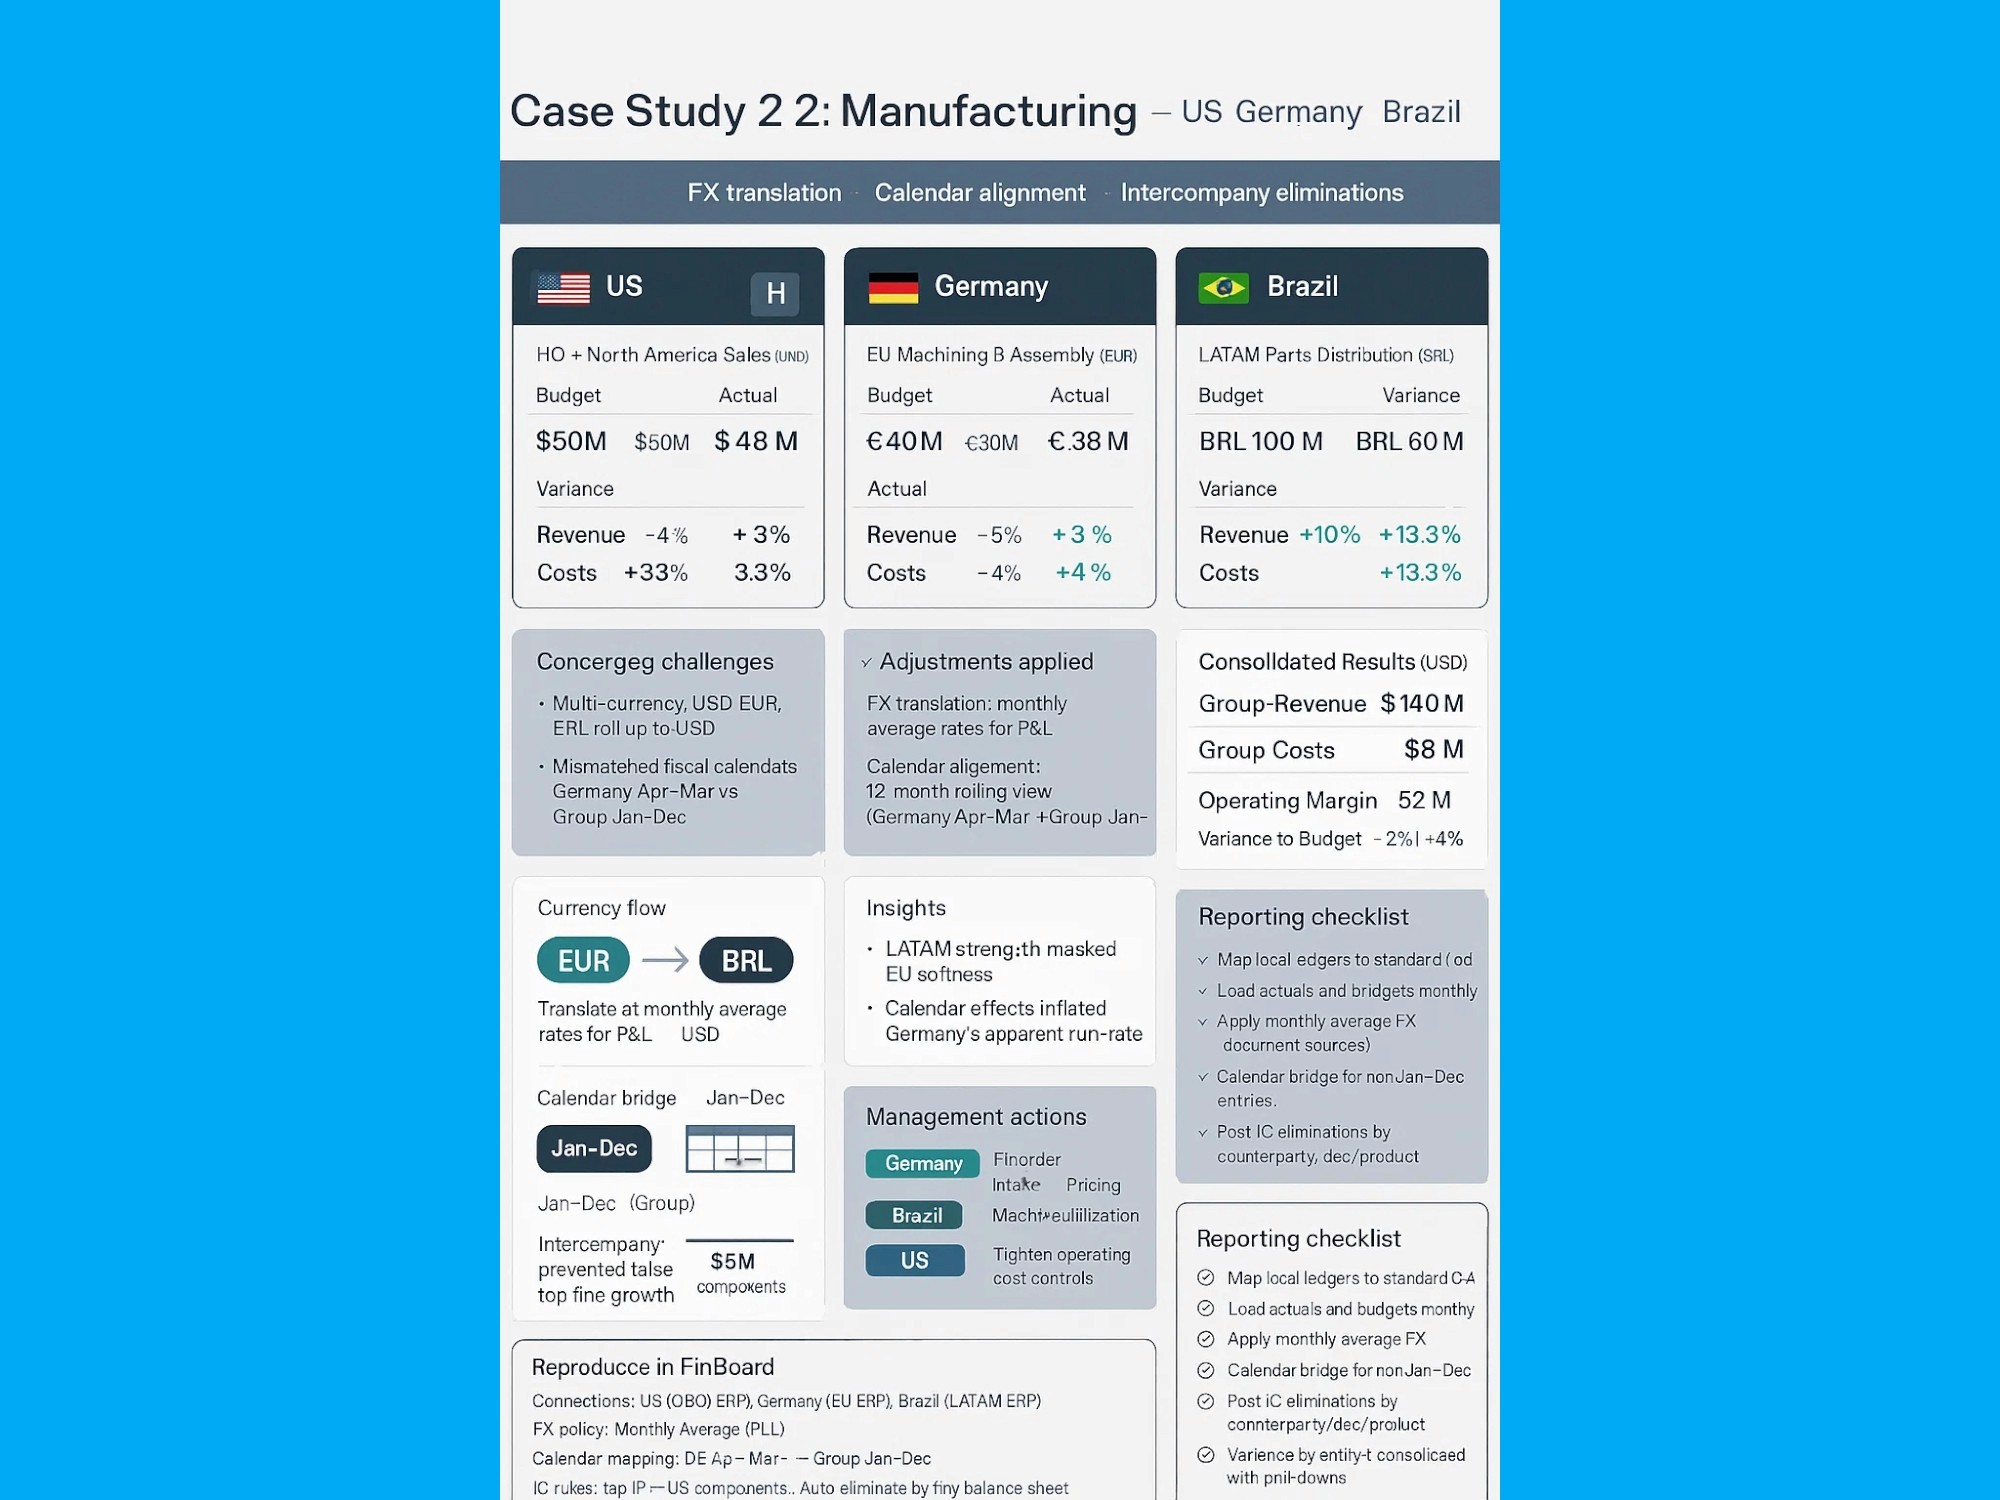
Case Study 2: Manufacturing Group with US, Germany, and Brazil Plants
Background
A multinational manufacturer operates three entities:
US: HQ and North America sales (USD).
Germany: EU machining and assembly (EUR).
Brazil: LATAM parts distribution (BRL).
Budget vs. Actuals (Local Currency)
US — Budget: $50M revenue, $30M costs → Actual: $48M revenue, $31M costs
Variance (local): Revenue –4%, Costs +3.3%Germany — Budget: €40M revenue, €25M costs → Actual: €38M revenue, €24M costs
Variance (local): Revenue –5%, Costs –4%Brazil — Budget: BRL 100M revenue, BRL 60M costs → Actual: BRL 110M revenue, BRL 68M costs
Variance (local): Revenue +10%, Costs +13.3%
Consolidation Challenges
Multi-currency: USD, EUR, and BRL must roll up to USD.
Mismatched fiscal calendars: Brazil Jan–Dec; Germany Apr–Mar.
Intercompany flows: Germany sells €5M components to US.
Adjustments Applied
FX translation: Translate EUR and BRL to USD using monthly average rates for P&L.
Calendar alignment: Build a 12-month rolling view so Germany’s Apr–Mar maps cleanly to the group’s Jan–Dec reporting.
Eliminations: Remove €5M intercompany revenue in Germany and the matching expense in US.
Consolidated Result (USD)
Group Revenue (post FX and eliminations): $140M
Group Costs: $88M
Variance to Budget: Revenue –2%, Costs +4%
Operating Margin: $52M (≈ 37.1%)
What the Roll-Up Revealed
LATAM strength masked EU softness: Brazil’s overperformance hid Germany’s revenue shortfall at the group level.
Calendar effects matter: Without the 12-month rolling alignment, Germany’s run-rate looked healthier than it was.
Eliminations avoid false growth: Removing the €5M related-party sale prevented inflated top-line and incorrect margin signals.
Management Actions
Germany: Address order intake and pricing for EU customers; review machine utilization and lead times.
Brazil: Secure supply for high-turn SKUs and maintain service levels to preserve growth quality.
US: Tighten operating cost controls given a soft top-line.
Group: Lock a monthly FX policy (average rate for P&L, closing for balance sheet) and formalize an intercompany markup and documentation pack.
Reporting Checklist (use this for monthly close)
Map local ledgers to a standard chart of accounts.
Load actuals and budgets at monthly granularity.
Apply monthly average FX for P&L; document sources and timeframes.
Build a calendar bridge for non-Jan–Dec entities.
Post intercompany eliminations by counterparty, doc number, and product family.
Produce variance analysis by entity and consolidated level with drill-downs.
Optional: How to Reproduce This in FinBoard
Connections: Link US (QBO/ERP), Germany (EU ERP), Brazil (LATAM ERP).
FX policy: Set Monthly Average (P&L); store rates by month.
Calendar mapping: Define Germany Apr–Mar → Group Jan–Dec rolling rule.
Intercompany rules: Tag Germany→US component sales and auto-eliminate by invoice line.
Views: Entity-level variance, consolidated P&L, and bridge (Budget → FX → Calendar → IC → Actual).
Controls: Exception report for untagged intercompany lines and rate gaps.
Insight: Strong LATAM growth masked weak EU performance. The consolidated view surfaced Germany’s underperformance early, prompting targeted commercial and capacity actions while preserving Brazil’s momentum.
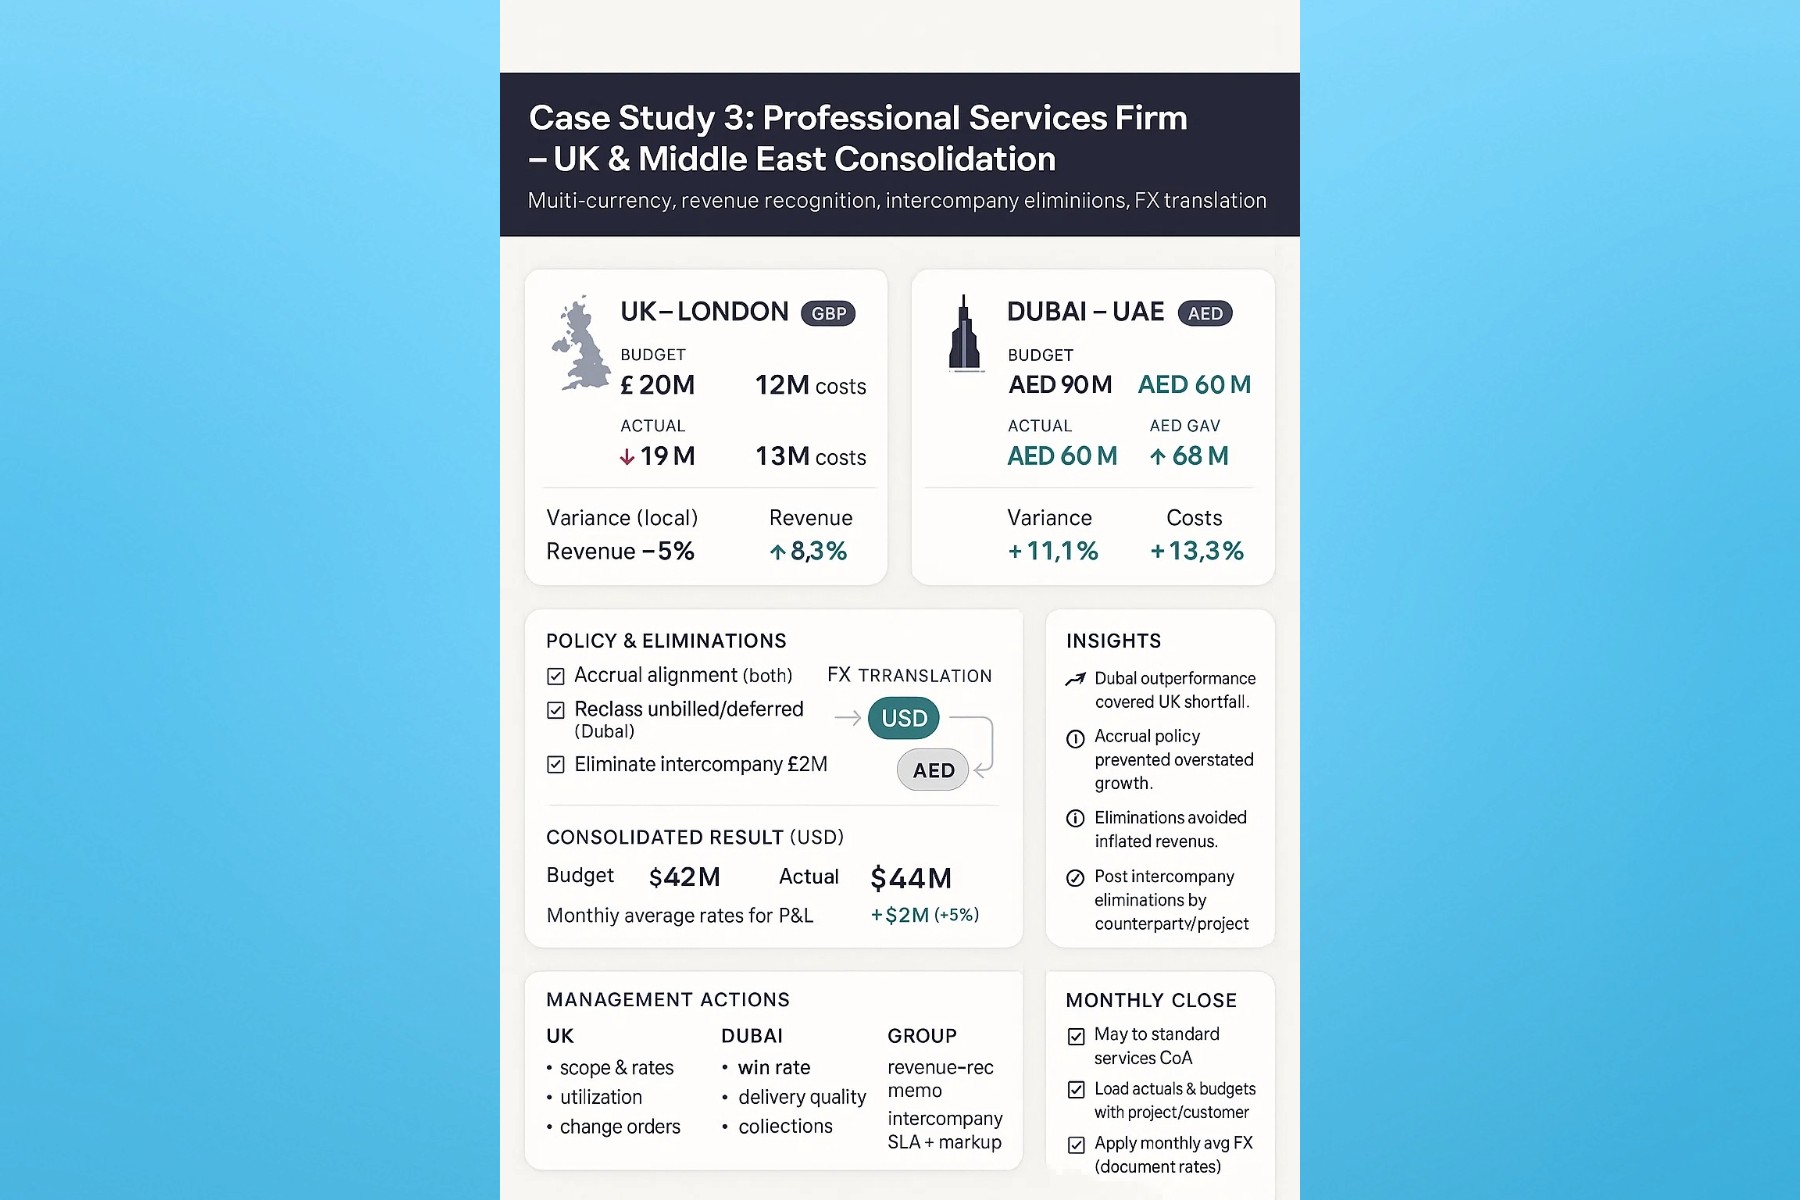
Case Study 3: Professional Services Firm with UK and Middle East Entities
Background
A consulting group operates two entities:
UK (London): Serves European clients (GBP).
Dubai (UAE): Delivers government projects across the Middle East (AED).
Budget vs. Actuals (Local Currency)
UK — Budget: £20M revenue, £12M costs → Actual: £19M revenue, £13M costs
Variance (local): Revenue –5%, Costs +8.3%Dubai — Budget: AED 90M revenue, AED 60M costs → Actual: AED 100M revenue, AED 68M costs
Variance (local): Revenue +11.1%, Costs +13.3%
Consolidation Challenges
Multi-currency: GBP and AED must roll up to USD.
Revenue recognition: UK on accrual; Dubai on cash.
Intercompany: UK cross-charges £2M for knowledge sharing.
Adjustments Applied
Policy alignment: Standardize both entities to accrual; reclass timing differences for Dubai’s unbilled and deferred items.
Eliminations: Remove £2M intercompany revenue/expense.
FX translation: Convert GBP and AED to USD using monthly average rates for the P&L.
Consolidated Result (USD)
Budget revenue: $42M
Actual revenue: $44M
Variance: +$2M (+5%)
Note: FX rates and revenue-recognition alignment affect period timing; costs and margins should be reviewed similarly in USD to complete the picture.
What the Roll-Up Revealed
Dubai’s growth offset UK slippage: Dubai’s outperformance covered the UK cost overrun and revenue shortfall.
Accounting policy matters: Cash-to-accrual alignment in Dubai prevented overstated growth from milestone cash receipts.
Eliminations protected signal: Removing the £2M cross-charge avoided inflated revenue and misread utilization.
Management Actions
UK: Tighten project scoping and rate cards; review utilization and bench costs; implement earlier change-order approvals.
Dubai: Safeguard win rate and delivery quality; monitor collection cycles to keep accruals aligned with billing milestones.
Group: Enforce a single revenue-recognition memo, intercompany SLA with markup policy, and a monthly FX source of record.
Reporting Checklist (monthly close)
Map local ledgers to a standard services CoA (fees, pass-throughs, subcontractors, travel).
Load actuals and budgets monthly with project and customer tags.
Apply monthly average FX for P&L; document rates and sources.
Align revenue recognition (accrual) with clear rules for WIP, unbilled AR, and deferrals.
Post intercompany eliminations by counterparty and project.
Produce variance analysis by entity, practice line, and top clients with drill-downs.
Insight: Dubai exceeded expectations and covered the UK’s cost overrun. The consolidated view made that explicit; without it, management could wrongly attribute growth to UK performance alone.
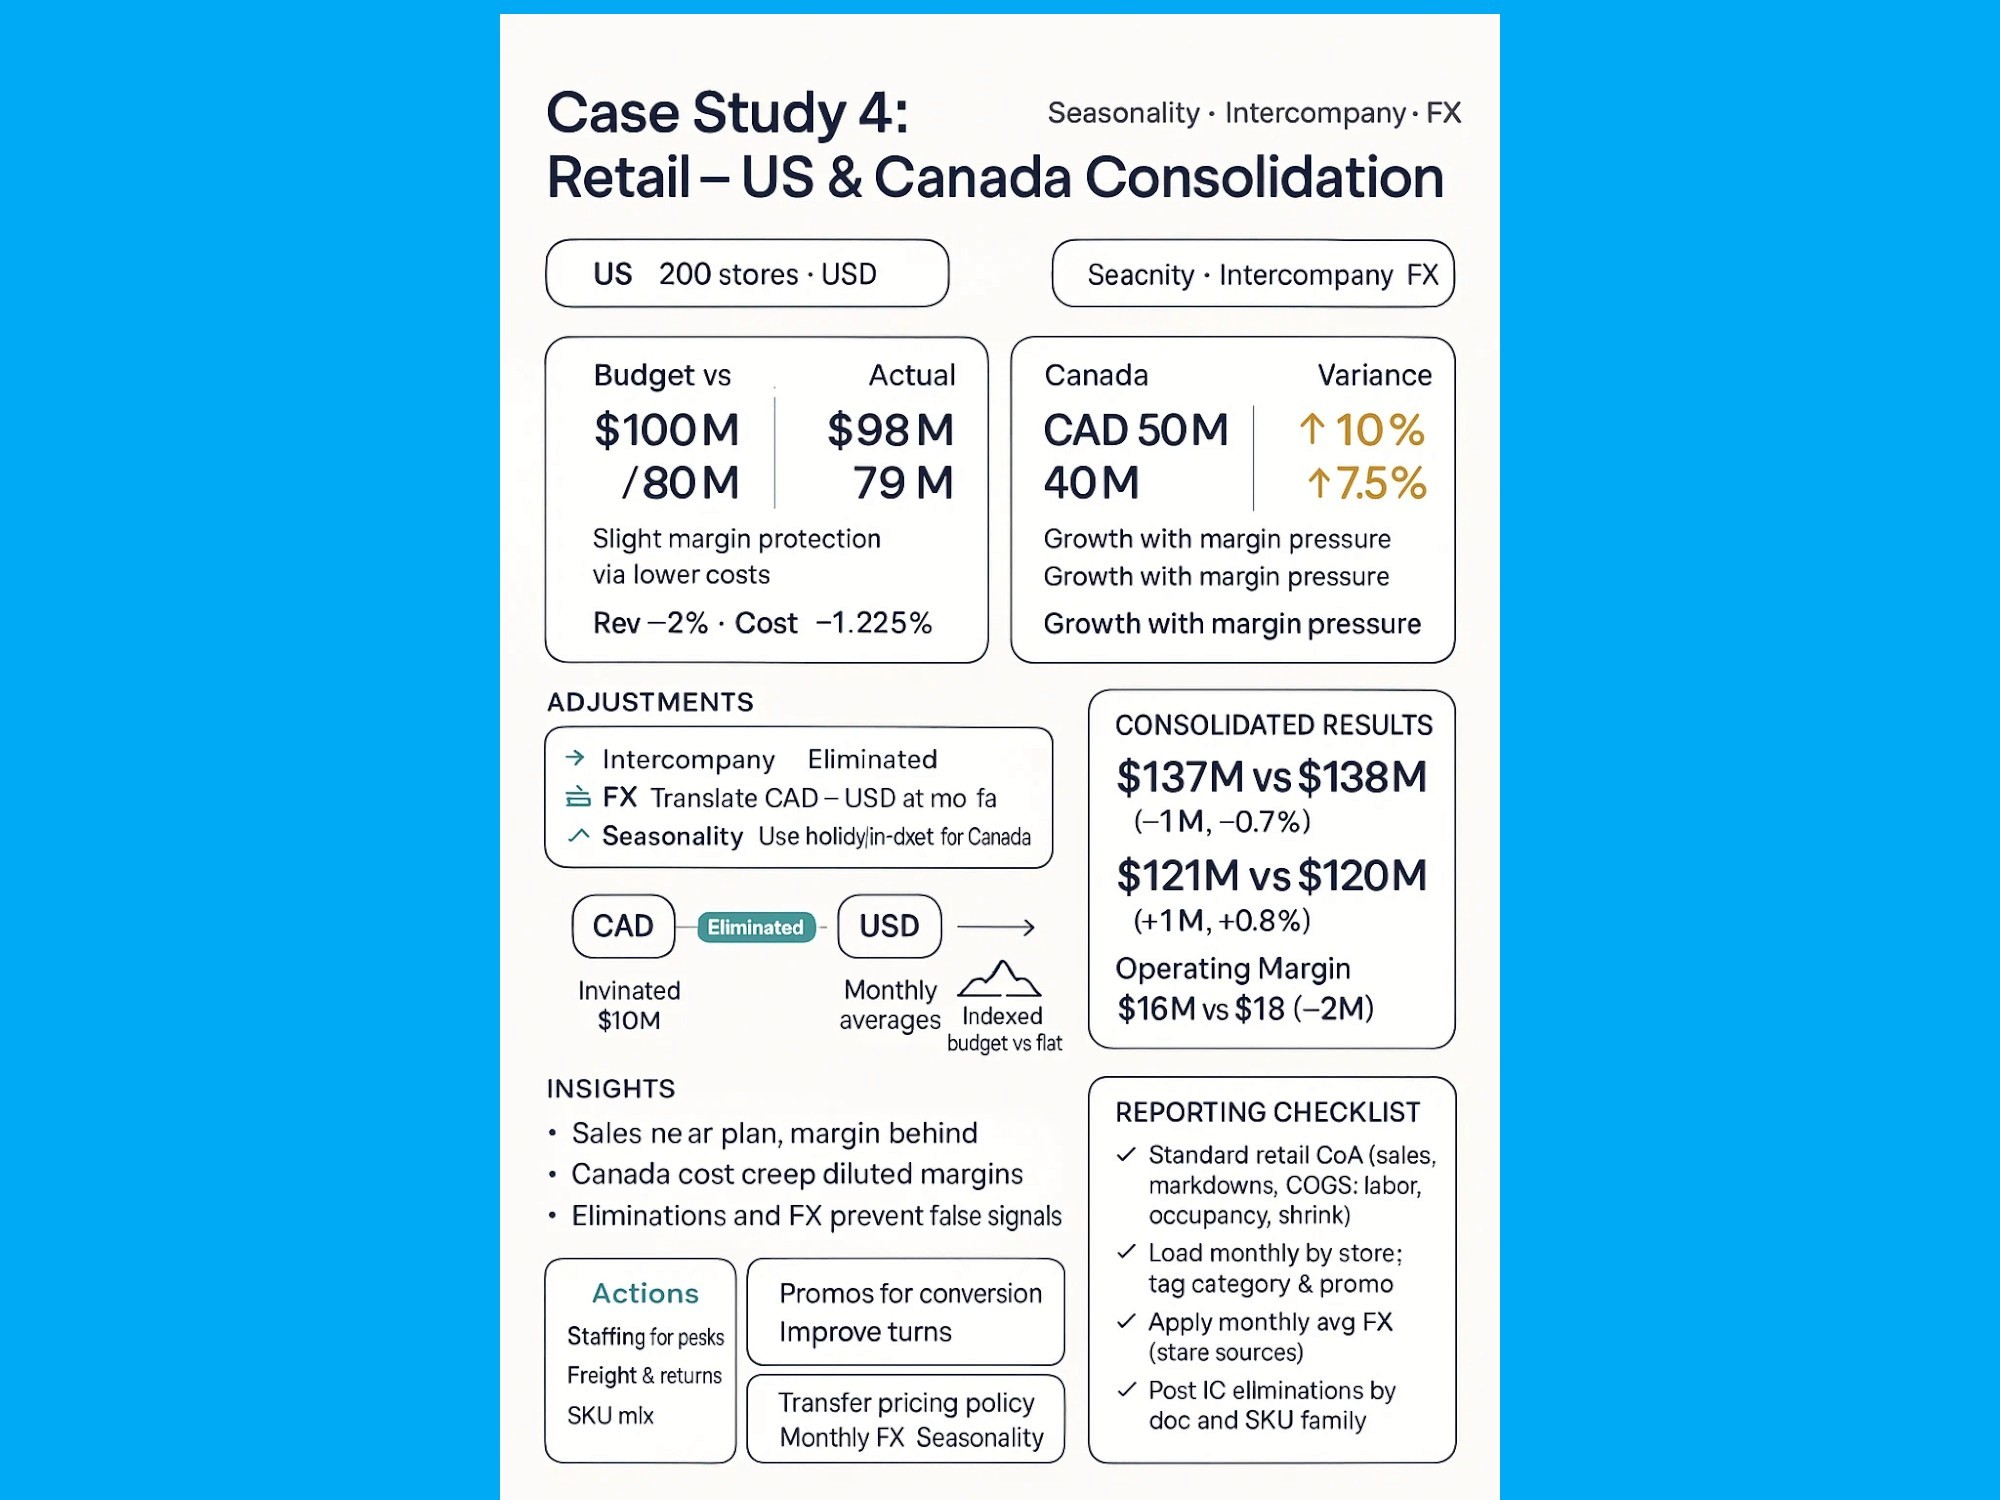
Case Study 4: Retail Chain with US and Canada Operations
Background
A mid-sized retailer runs two entities:
US: 200 stores across multiple states (USD).
Canada: 50 stores in Ontario and Quebec (CAD).
Budget vs. Actuals (Local Currency)
US — Budget: $100M revenue, $80M costs → Actual: $98M revenue, $79M costs
Variance (local): Revenue –2%, Costs –1.25% → Margin slightly protected by lower costsCanada — Budget: CAD 50M revenue, CAD 40M costs → Actual: CAD 55M revenue, CAD 43M costs
Variance (local): Revenue +10%, Costs +7.5% → Growth with margin pressure
Consolidation Challenges
Seasonality: Canada’s plan is front-loaded for the holiday period; timing skews simple month-over-month comparisons.
Intercompany inventory: US ships $10M of goods to Canada at transfer prices.
FX exposure: CAD→USD translation obscures true unit economics.
Adjustments Applied
Intercompany eliminations: Remove $10M related-party revenue in US and the matching COGS/expense in Canada.
FX translation: Convert CAD to USD using monthly average rates for P&L.
Seasonality normalization: Compare Canada actuals to a seasonality-indexed budget (holiday uplift) rather than a flat phasing.
Consolidated Result (USD)
Revenue (post eliminations): $137M vs $138M budget → –$1M (–0.7%)
Costs: $121M vs $120M budget → +$1M (+0.8%)
Operating Margin: $16M vs $18M budget → –$2M margin shortfall
What the Roll-Up Revealed
Sales nearly on plan, margin behind: Group missed revenue slightly but overspent, compressing margin.
Canada’s cost creep: Despite strong top-line, higher labor and store operating costs diluted Canadian margins.
Transfers can distort: Without eliminations, US would appear stronger and Canada weaker than reality.
FX matters for pacing: CAD strength/weakness against USD changed the optics of Canada’s performance even when unit volumes improved.
Management Actions
Canada:
Re-baseline staffing models for peak weeks; tighten scheduling and overtime.
Negotiate freight and last-mile for winter periods; review shrink and returns.
Add SKU-level mix analysis to confirm whether growth came from lower-margin categories.
US:
Improve conversion and basket size with targeted promos rather than blanket discounts.
Optimize inventory turns to reduce carrying costs ahead of peak periods.
Group:
Formalize transfer-pricing policy (markup, cadence, documentation).
Adopt monthly average FX for P&L, closing rate for balance sheet; disclose FX impact in the bridge.
Standardize a seasonality index by region (holiday, back-to-school, weather).
Reporting Checklist (monthly close)
Map both ledgers to a standard retail CoA (sales, markdowns, COGS, labor, occupancy, shrink).
Load actuals and budgets monthly by store; tag category and promotion.
Apply monthly average FX to Canada P&L; store rate sources for audit.
Post intercompany eliminations by document and SKU family.
Produce a Budget → FX → Seasonality → Intercompany → Actual bridge with drill-downs.
Track labor % of sales, gross margin %, inventory turns, and shrink at entity and consolidated levels.
Insight: The group almost met top-line targets, but consolidated reporting exposed margin compression in Canada, primarily from rising labor costs during peak weeks. Without eliminations, FX normalization, and seasonal indexing, management could misread where performance actually drifted.
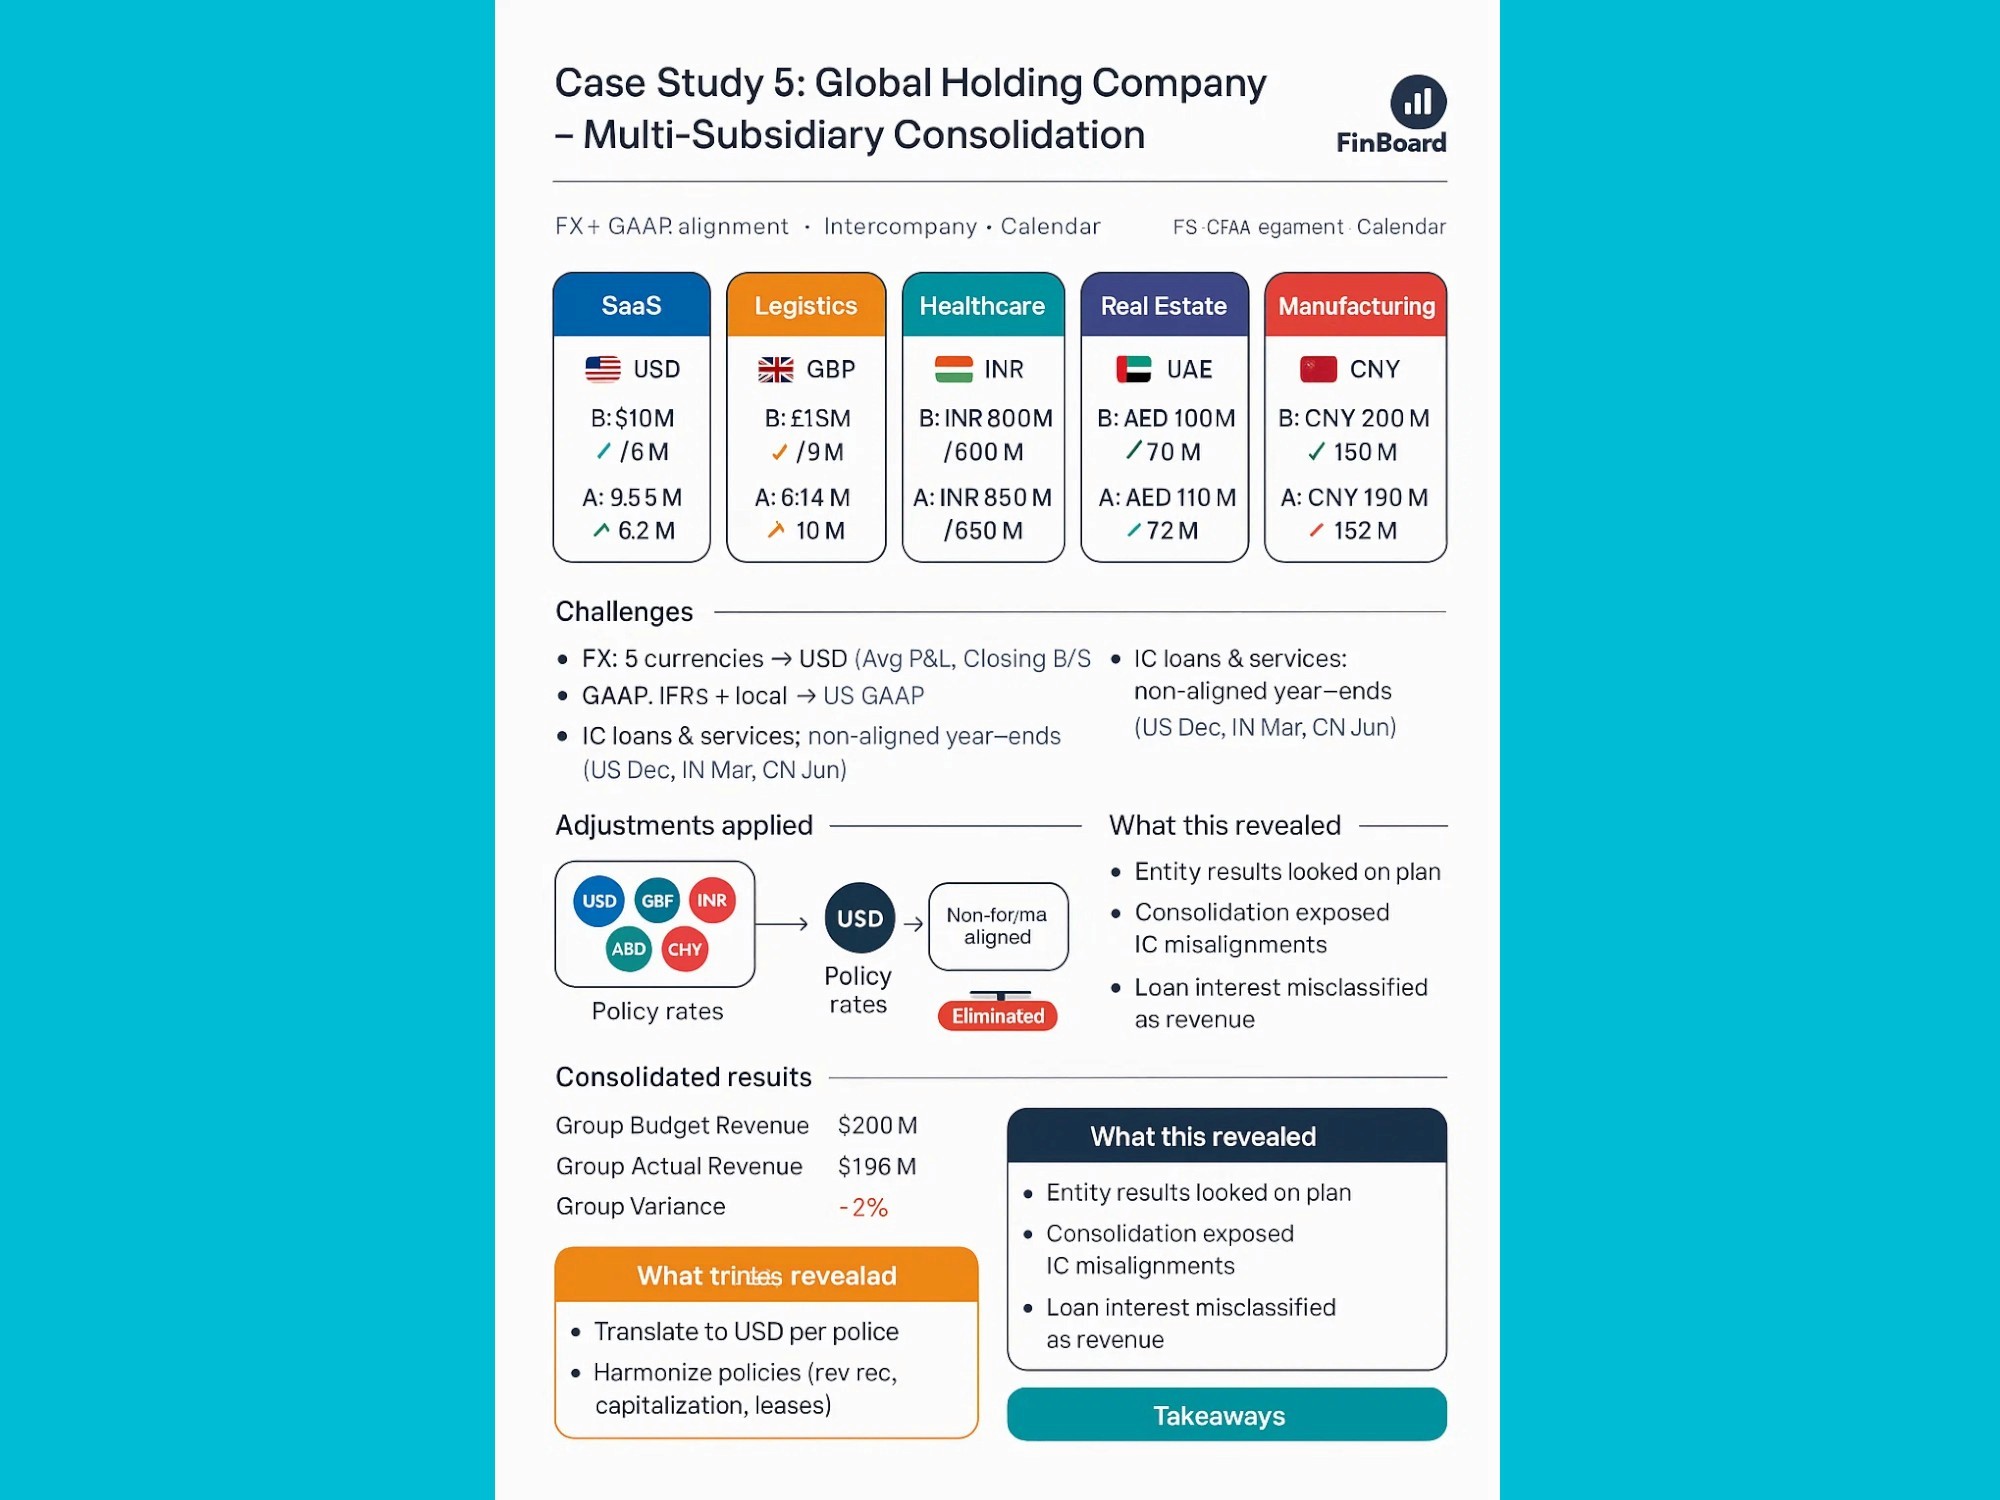
Case Study 5: Global Holding Company with Multiple Subsidiaries
Background
A private-equity–owned holding company manages five portfolio entities across jurisdictions and currencies:
SaaS — United States
Logistics — United Kingdom
Healthcare — India
Real Estate — United Arab Emirates
Manufacturing — China
Budgets (local currency)
SaaS: $10M revenue, $6M costs
Logistics: £15M revenue, £9M costs
Healthcare: INR 800M revenue, INR 600M costs
Real estate: AED 100M revenue, AED 70M costs
Manufacturing: CNY 200M revenue, CNY 150M costs
Actuals (local currency; translated to USD for consolidation)
SaaS: $9.5M revenue, $6.2M costs
Logistics: £14M revenue, £10M costs
Healthcare: INR 850M revenue, INR 650M costs
Real estate: AED 110M revenue, AED 72M costs
Manufacturing: CNY 190M revenue, CNY 152M costs
Consolidation Challenges
Five currencies and translation methodology (average rate for P&L, closing rate for B/S).
Mixed accounting frameworks (IFRS and local GAAP) versus group policy under US GAAP.
Multiple intercompany loans and service agreements with transfer-pricing markups.
Non-aligned fiscal year-ends (US: Dec, India: Mar, China: Jun) requiring pro-forma alignment.
Normalization & Adjustments
Translate all entities to USD reporting currency using policy rates.
Harmonize accounting policies to US GAAP (revenue recognition, capitalization rules, leases).
Align reporting calendars via pro-rata and cutoff adjustments.
Eliminate intercompany loans and service fees (net $20M) and reclassify misposted items.
Consolidated Results (USD)
Group Budget Revenue: $200M
Group Actual Revenue: $196M
Group Variance: –2%
What This Revealed
Entity-level performance appeared close to plan, but consolidation exposed intercompany misalignments and loan interest misclassified as revenue.
Systematic eliminations and policy alignment were essential to produce investor-ready financials and avoid overstated topline metrics.
Takeaways
Define a single source of truth for FX rates, calendars, and GAAP policies.
Automate intercompany eliminations and variance explanations at consolidation time.
Require audit-ready mappings (accounts, entities, classes) so reviewers can drill from group to transaction.
Advanced Considerations for Accountants
Deferred Revenue Alignment: SaaS entities often record deferred revenue differently. Budget models should align recognition policies.
Headcount vs Payroll Variances: A common source of budget misses. Consider reporting FTE variance separately.
Capex vs Opex Tracking: Groups investing across multiple subsidiaries need clear rules on capitalization.
SOX/Internal Controls: Document review and approval of eliminations. Maintain audit trail.
IFRS vs US GAAP Differences: Treatment of FX, leases (ASC 842 vs IFRS 16), and revenue recognition (ASC 606 vs IFRS 15) can materially affect consolidated variances.

Future Trends in Consolidated Budget vs Actual
AI-driven consolidation tools: detect intercompany mismatches automatically.
Continuous close: instead of waiting for month-end, rolling consolidation updates daily.
Predictive variance analysis: systems that don’t just report variances but flag likely future deviations.
Integration with SaaS metrics: especially for tech companies, tying ARR/MRR metrics to consolidated financials for board packs.
FAQ
Q1. Can QuickBooks Online consolidate budget vs actual by itself?
No. QuickBooks Online only supports single-entity budgets. Consolidation requires exports or usage of third-party apps like FinBoard.ai
Q2. What is the difference between budget rate and actual rate for FX?
Budget rate fixes conversion for planning, while actual rate applies monthly rates. Both must be disclosed.
Q3. Do intercompany eliminations apply to budgets as well as actuals?
Yes. Both must be adjusted, or variances will be distorted.
Q4. How often should consolidated budget vs actual be prepared?
Best practice is monthly for management and quarterly for board packs.
Q5. What add-ons integrate with QuickBooks Online for consolidation?
FinBoard.ai is a common third party tool.
Glossary
Budget Rate: Fixed FX rate used for translating budgets.
Chart of Accounts (COA): Framework for classifying accounts.
Consolidation: Combining multiple entities into one set of financials.
Elimination: Removal of intercompany revenue, expenses, assets, or liabilities.
Variance Analysis: Comparing actual results with budget.